weberwildcat
Active member
Game 1 Utah State: 9,169 - season high
Game 2 San Jose State: 5,584
Game 3 Saint Katherine College: 5,260
Game 4 Northern New Mexico: 5,746
Game 5 Eastern Washington: 5,748
Game 6 Portland State: 6,007
Game 7 Southern Utah: 7,479
Game 8 Idaho State: 6,107
Game 9 Montana State: 7,358
Game 10 Montana: 8,566
Game 11 North Dakota: 6,294
Game 12 Northern Colorado: 8,151
Game 13 Sacramento State: 7,886
Game 14 Northern Arizona: 8,463
Game 15 Mar 14, Northern Colorado (Big Sky Tournament semifinal): 5,228 - season low
Game 16 Mar 15, North Dakota (Big Sky Tournament championship): 6,294
Final Season Average: 6,834
Total: 109,340
High: 9,169
Low: 5,228
2012-13
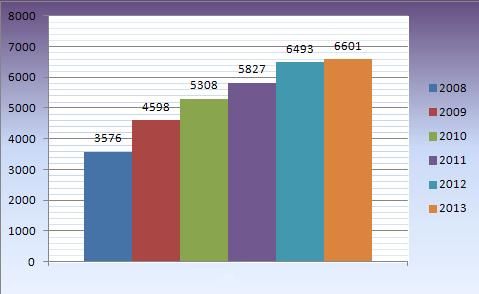
Average: 6,601 (15th highest DI attendance average in the West)
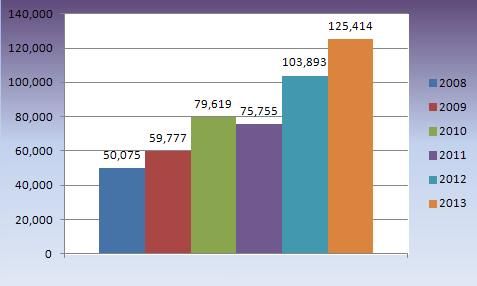
Total: 125,414
Single game high: 10,583
Single game low: 2,309
2011-12
Average: 6,493
Total: 103,893
Single game high: 9,359
Single game low: 2,334
2010-11
Average: 5,827 (19th highest DI attendance average in the West)
Total: 75,755
Single game high: 10,453
Single game low: 3,683
2009-10
Season average: 5,308 (21st highest DI attendance average in the West)
Season total: 79,619
Single game high: 9,272
2008-09
Season average: 4,598
Season total: 59,777
Single game high: 7,401
2007-08
Season average: 3,576
Season total: 50,075
Single game high: 7,797
2008-2013 year-by-year attendance average

2008-2013 year-by-year overall attendance

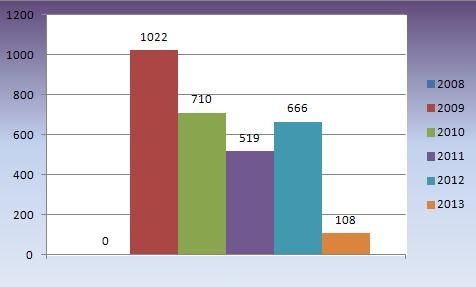
2008-2013 year-by-year attendance average increase

Weber top 10 home overall attendance
1. 1980: 167,762 (17 games)
2. 1984: 130,821 (16)
3. 2013: 125,414 (19)
4. 1985: 124,237 (16)
5. 1983: 122,914 (16)
6. 1979: 117,194 (15)
7. 1986: 116,223: (15)
8. 1978: 115,129 (15)
9. 1987: 107,614 (14)
10. 1982: 104,342 (16)
11. 2012: 103,893 (15)
-Until 2011-12 Weber hadn't averaged over 6,000 since 2002-03 (6,641).
-2011-12's 103,893 was the first time Weber cracked 100,000 total attendance since 1987 (107,614).
-1995-96 team was the last to average more than 6,700 (6,771). Had we not hosted that CIT game vs UVU in 2012 our season average last yr would have been exactly 6,771.
-School record average is 10,500 in 1979-80 (16 home games) and 167,762 overall also school and Big Sky record.
-2012-13: Home crowd of 10,583 was the largest home crowd since 2003's 10,820 (BYU). The 19 home games played set a new WSU record. Hosting ISU was the highest regular season big sky attended home game since 2003 - 8,758.
Game 2 San Jose State: 5,584
Game 3 Saint Katherine College: 5,260
Game 4 Northern New Mexico: 5,746
Game 5 Eastern Washington: 5,748
Game 6 Portland State: 6,007
Game 7 Southern Utah: 7,479
Game 8 Idaho State: 6,107
Game 9 Montana State: 7,358
Game 10 Montana: 8,566
Game 11 North Dakota: 6,294
Game 12 Northern Colorado: 8,151
Game 13 Sacramento State: 7,886
Game 14 Northern Arizona: 8,463
Game 15 Mar 14, Northern Colorado (Big Sky Tournament semifinal): 5,228 - season low
Game 16 Mar 15, North Dakota (Big Sky Tournament championship): 6,294
Final Season Average: 6,834
Total: 109,340
High: 9,169
Low: 5,228
2012-13
Average: 6,601 (15th highest DI attendance average in the West)
Total: 125,414
Single game high: 10,583
Single game low: 2,309
2011-12
Average: 6,493
Total: 103,893
Single game high: 9,359
Single game low: 2,334
2010-11
Average: 5,827 (19th highest DI attendance average in the West)
Total: 75,755
Single game high: 10,453
Single game low: 3,683
2009-10
Season average: 5,308 (21st highest DI attendance average in the West)
Season total: 79,619
Single game high: 9,272
2008-09
Season average: 4,598
Season total: 59,777
Single game high: 7,401
2007-08
Season average: 3,576
Season total: 50,075
Single game high: 7,797
2008-2013 year-by-year attendance average

2008-2013 year-by-year overall attendance

2008-2013 year-by-year attendance average increase

Weber top 10 home overall attendance
1. 1980: 167,762 (17 games)
2. 1984: 130,821 (16)
3. 2013: 125,414 (19)
4. 1985: 124,237 (16)
5. 1983: 122,914 (16)
6. 1979: 117,194 (15)
7. 1986: 116,223: (15)
8. 1978: 115,129 (15)
9. 1987: 107,614 (14)
10. 1982: 104,342 (16)
11. 2012: 103,893 (15)
-Until 2011-12 Weber hadn't averaged over 6,000 since 2002-03 (6,641).
-2011-12's 103,893 was the first time Weber cracked 100,000 total attendance since 1987 (107,614).
-1995-96 team was the last to average more than 6,700 (6,771). Had we not hosted that CIT game vs UVU in 2012 our season average last yr would have been exactly 6,771.
-School record average is 10,500 in 1979-80 (16 home games) and 167,762 overall also school and Big Sky record.
-2012-13: Home crowd of 10,583 was the largest home crowd since 2003's 10,820 (BYU). The 19 home games played set a new WSU record. Hosting ISU was the highest regular season big sky attended home game since 2003 - 8,758.
