weberwildcat
Active member
Game 1 Arizona Christian: 4,937
Game 2 Utah Valley: 5,553
Game 3 UC Irvine: 5,761
Game 4 BYU: 8,695
Game 5 Southwest: 5,822
Game 6 Northern Colorado: 5,612
Game 7 North Dakota: 5,813
Game 8 Northern Arizona: 6,077
Game 9 Sac State: 6654
Game 10 SUU: 7,168
Game 11 Idaho State: 8,758
Game 12 Montana: 7,494
Game 13 Montana State: 7,046
Game 14 Portland State: 6,835 (Spring Break)
Game 15 Eastern Washington: 7,546
Game 16 CIT 1st Rd: Cal Poly - 2,309 Season Low
Game 17 CIT 2nd: Air Force - 6,113
Game 18 CIT Quarterfinal: Oral Roberts - 6,638
Game 19 CIT Championship: East Carolina - 10,583 - Season high
Average: 6,601
Total: 125,414
Single game high: 10,583
Single game low: 2,309
*125,414: 3rd highest overall attendance in WSU history and highest since 1984.
*10,583: largest home crowd since 2003's 10,820 (BYU)
*19 home games, new WSU record.
*ISU game was the highest regular season big sky attended home game since 2003.
Weber top 10 home overall attendance
1. 1980: 167,762 (17 games)
2. 1984: 130,821 (16)
3. 2013: 125,414 (19)
4. 1985: 124,237 (16)
5. 1983: 122,914 (16)
6. 1979: 117,194 (15)
7. 1986: 116,223: (15)
8. 1978: 115,129 (15)
9. 1987: 107,614 (14)
10. 1982: 104,342 (16)
11. 2012: 103,893 (15)
-Until 2011-12 Weber hadn't averaged over 6,000 since 2002-03 (6,641).
-2011-12's 103,893 was the first time Weber cracked 100,000 total attendance since 1987 (107,614).
-1995-96 team was the last to average more than 6,700 (6,771). Had we not hosted that CIT game vs UVU in 2012 our season average last yr would have been exactly 6,771.
-School record average is 10,500 in 1979-80 (16 home games) and 167,762 overall also school and Big Sky record.
2012-13
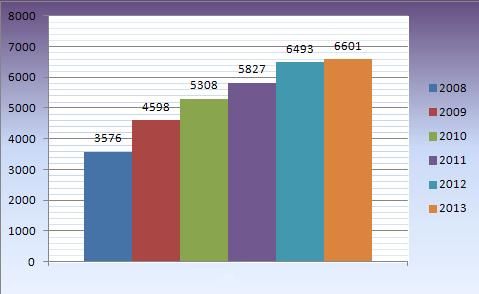
Average: 6,601 (15th highest DI attendance average in the West)
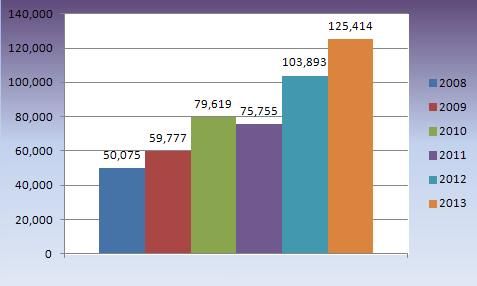
Total: 125,414
Single game high: 10,583
Single game low: 2,309
2011-12
Average: 6,493
Total: 103,893
Single game high: 9,359
Single game low: 2,334
2010-11
Average: 5,827 (19th highest DI attendance average in the West)
Total: 75,755
Single game high: 10,453
Single game low: 3,683
2009-10
Season average: 5,308 (21st highest DI attendance average in the West)
Season total: 79,619
Single game high: 9,272
2008-09
Season average: 4,598
Season total: 59,777
Single game high: 7,401
2007-08
Season average: 3,576
Season total: 50,075
Single game high: 7,797
2008-2013 year-by-year attendance average

2008-2013 year-by-year overall attendance

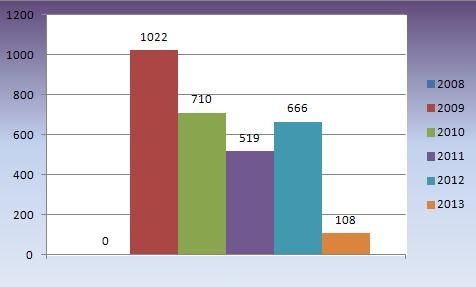
2008-2013 year-by-year attendance average increase

2007 to 2008 is actually a decrease in attendance average. but every year since has had an increase for example from 2008 to 2009 WSU saw an attendance average increase of 1,022 fans; then 2010 saw 710 more fans per game than 2009.
from what i can gather from these charts is that weber state basketball attendance has peaked. it has varied somewhat based on the different number of games per season such as 2013 having a big sky record 19 home games but 2011 only had 13 home games.
we shall see what 2013-14 brings us! you never know...
Game 2 Utah Valley: 5,553
Game 3 UC Irvine: 5,761
Game 4 BYU: 8,695
Game 5 Southwest: 5,822
Game 6 Northern Colorado: 5,612
Game 7 North Dakota: 5,813
Game 8 Northern Arizona: 6,077
Game 9 Sac State: 6654
Game 10 SUU: 7,168
Game 11 Idaho State: 8,758
Game 12 Montana: 7,494
Game 13 Montana State: 7,046
Game 14 Portland State: 6,835 (Spring Break)
Game 15 Eastern Washington: 7,546
Game 16 CIT 1st Rd: Cal Poly - 2,309 Season Low
Game 17 CIT 2nd: Air Force - 6,113
Game 18 CIT Quarterfinal: Oral Roberts - 6,638
Game 19 CIT Championship: East Carolina - 10,583 - Season high
Average: 6,601
Total: 125,414
Single game high: 10,583
Single game low: 2,309
*125,414: 3rd highest overall attendance in WSU history and highest since 1984.
*10,583: largest home crowd since 2003's 10,820 (BYU)
*19 home games, new WSU record.
*ISU game was the highest regular season big sky attended home game since 2003.
Weber top 10 home overall attendance
1. 1980: 167,762 (17 games)
2. 1984: 130,821 (16)
3. 2013: 125,414 (19)
4. 1985: 124,237 (16)
5. 1983: 122,914 (16)
6. 1979: 117,194 (15)
7. 1986: 116,223: (15)
8. 1978: 115,129 (15)
9. 1987: 107,614 (14)
10. 1982: 104,342 (16)
11. 2012: 103,893 (15)
-Until 2011-12 Weber hadn't averaged over 6,000 since 2002-03 (6,641).
-2011-12's 103,893 was the first time Weber cracked 100,000 total attendance since 1987 (107,614).
-1995-96 team was the last to average more than 6,700 (6,771). Had we not hosted that CIT game vs UVU in 2012 our season average last yr would have been exactly 6,771.
-School record average is 10,500 in 1979-80 (16 home games) and 167,762 overall also school and Big Sky record.
2012-13
Average: 6,601 (15th highest DI attendance average in the West)
Total: 125,414
Single game high: 10,583
Single game low: 2,309
2011-12
Average: 6,493
Total: 103,893
Single game high: 9,359
Single game low: 2,334
2010-11
Average: 5,827 (19th highest DI attendance average in the West)
Total: 75,755
Single game high: 10,453
Single game low: 3,683
2009-10
Season average: 5,308 (21st highest DI attendance average in the West)
Season total: 79,619
Single game high: 9,272
2008-09
Season average: 4,598
Season total: 59,777
Single game high: 7,401
2007-08
Season average: 3,576
Season total: 50,075
Single game high: 7,797
2008-2013 year-by-year attendance average

2008-2013 year-by-year overall attendance

2008-2013 year-by-year attendance average increase

2007 to 2008 is actually a decrease in attendance average. but every year since has had an increase for example from 2008 to 2009 WSU saw an attendance average increase of 1,022 fans; then 2010 saw 710 more fans per game than 2009.
from what i can gather from these charts is that weber state basketball attendance has peaked. it has varied somewhat based on the different number of games per season such as 2013 having a big sky record 19 home games but 2011 only had 13 home games.
we shall see what 2013-14 brings us! you never know...

